Configure Grafana-Dashboards
Here is the translated text:
Dashboard Configuration
Select "Data Source and Point" in the import template and save the dashboard with the defined variables:
| Variable | Definition |
|---|---|
language |
de |
title |
title |
subtitle |
subtitle |
companyInfo |
companyInfo |
coverTitle |
coverTitle |
coverSubtitle |
coverSubtitle |
coverPreparedBy |
coverPreparedBy |
selectedInterval |
5s, 10s, 30s, 1m, 5m, 30m, 60m |
aggrFunction |
max, min, mean |
mathVar |
1, 10, 20, 50, 100 |
logo |
https://i.ibb.co/G7McTPD/placeholder-logo.png |
freeTextVar |
Freitext |
Customizing Value Display
aggrFunction
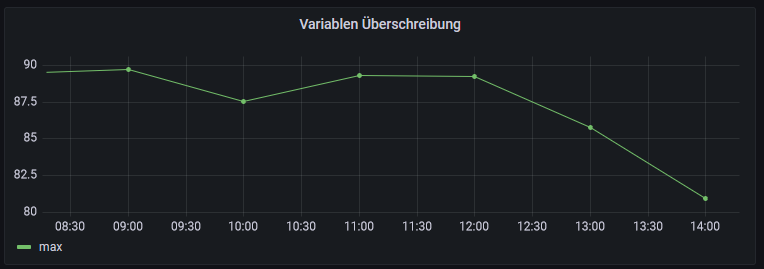
The aggrFunction variable is used to determine the aggregation function that will be applied to your data in your dashboard. You can use this variable to decide how your data should be aggregated, for example by averaging (mean), summing (sum), counting (count), etc.


selectedInterval
The selectedInterval variable is used to determine the time interval for aggregating your data in your dashboard. You can use this variable to decide over which time period your data should be aggregated, for example per minute, per hour, per day, etc.
Data Transformation
mathVar
The mathVar variable in Grafana is used to apply mathematical operations on your data before it's displayed in a panel. You can use this variable to perform calculations like addition, subtraction, multiplication, division or more complex mathematical functions on your data. This can be useful for normalizing data, calculating percentages or other types of data manipulation before the data is visualized.
Further Applications
freeTextVar
The freeTextVar variable in Grafana allows you to define a free text as a variable. This can be useful if you want to reuse a specific text or string across multiple panels in your dashboard. You can define the value of the freeTextVar variable and then use this variable in your panel titles, queries or other parts of your dashboard. This can help increase consistency in your dashboard and make it easier to reuse text.
After creating a Grafana dashboard, it can also be set up as a dashboard in the Settings app. Then, reports can be created for the set-up dashboard as described here.
Let me know if you have any further requests!